Over the past several decades, water levels in the central and southern regions of the Ogallala Aquifer have continuously dropped to the point that meeting the full irrigation demand of agricultural crops has become extremely challenging. In some areas, farmers have had to combine multiple wells to irrigate a single field or to limit the irrigated area to only a fraction of the field. To increase the longevity of this shrinking resource and to improve crop production with the limited water available, it is important to have a good understanding of the location and spatial distribution of irrigated areas within the central and southern Ogallala.
To increase the longevity of this shrinking resource and to improve crop production with the limited water available, it is important to have a good understanding of the location and spatial distribution of irrigated areas within the central and southern Ogallala.
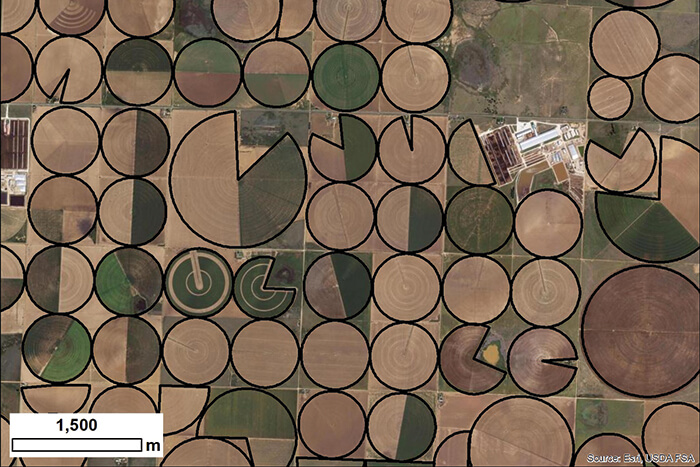
Most previous studies in this field have relied on automated analyses of satellite imagery to classify image pixels into irrigated and nonirrigated. However, automatic classification approaches may have some errors, especially when differentiating irrigated crops from natural vegetation that may appear similarly in satellite imagery. In addition, these approaches do not delineate the boundaries of irrigated fields, which offers many practical applications. For instance, a geographical database of field boundaries can be used to extract soil and vegetation data for each field to be used for evaluating system performance and for developing variable rate irrigation prescriptions.
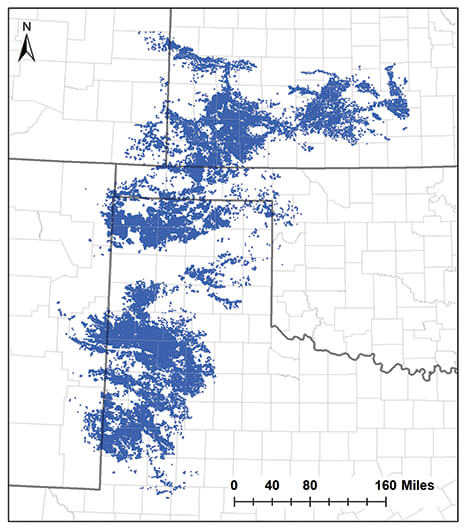
Recently, a team of researchers and extension specialists at Oklahoma State University developed a geospatial database of all center pivot-irrigated fields in the central and southern regions of the Ogallala Aquifer. This was accomplished by manually digitizing the borders of all center pivot-irrigated fields. A total of 50,116 center pivots were identified and digitized in the study area, with about 56% (28,055) of them being in the central region and the rest in the southern region. Among the five states that overlay parts of the central and southern Ogallala, Colorado had the smallest number of center pivots (875) and Texas had the largest (27,796).
The delineated center pivots had a wide range of area, but a large majority of them were 121-128 acres in size. Thirteen center pivots had an area larger than 568 acres and almost all of them were in three Texas counties: Hartley, Hutchinson and Deaf Smith. Most center pivots covered a full circle, with percentages ranging from 85% in Texas to 92% in Colorado. The remaining systems did not cover a full circle due to the presence of obstructions such as buildings, trees, railroads, state/county roads, etc.
The digitized center pivot layer was used to extract data on changes in depth to groundwater from predevelopment (before 1950) to 2015. When averaged among the center pivots in each of the five states overlying the central and southern Ogallala, Colorado had the smallest change in depth to groundwater, with an average decline of about 12 feet. Texas had the largest change of 83 feet decline from predevelopment to 2015.


