By now, you have most likely heard the term distribution uniformity and understand that it is a ratio of water applied (either by depth or volume) to the lowest quarter of the field (often the target) compared to the water applied on average to the entire field. The formula is as follows:
DU = Average of the worst quarter of the field / Average over the whole field
You are likely also very familiar with the performance measure being a decimal value between 0 and 1.0, where 1.0 means the water application was perfectly uniform. There is an ample amount written on DU from an engineering perspective. However, it can be difficult to translate this engineering performance term into a use case for different business choices — like making system improvements. As such, DU may be better understood in dollar terms.

Let’s use almonds as a basis for discussion. There were approximately 1.5 million acres of almonds grown in California in 2024. This specialty crop requires several financial inputs to produce good yields. In fact, the University of California, Davis, estimates that almond growers spend around $1,155 per year (Table 1) on power to pump groundwater, apply fertilizers via the irrigation system and pay for labor and water testing to meet the management target (that where seven-eighths of the field receives the target and more). With an assumed application efficiency of 0.90, the average acre receives input costs equivalent to $1,283 per year.
This means that for a 160-acre field of almonds, a grower with an application efficiency (or DU, assuming perfect timing) of 0.90 will spend $205,280 a year to irrigate and fertilize the trees. This does not include costs for pest or disease control, pruning, weed maintenance or any other cultural practice. For this case study, we will focus on irrigation, fertigation, maintenance of the irrigation system itself and its associated labor.
Evaluating the performance of an irrigation system is essential to ensuring that resources such as water and fertilizers are distributed uniformly and cost-effectively. A poor-performing system can lead to significant additional expenses due to these various financial inputs being unevenly applied to the field. The following is a nontechnical analysis of the results, translating the technical aspects of DU into economic terms to help growers understand the financial implications of irrigation system performance.

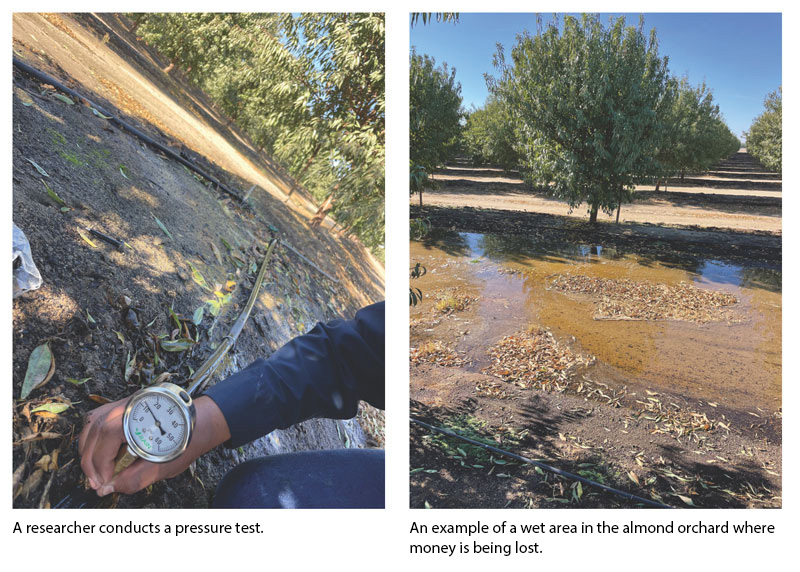
Recently, Laurel Ag & Water evaluated a drip irrigation system for 160 acres of almonds installed in 2020. The system was designed and installed by unnamed others and experiencing weak growth in parts of the field. Laurel Ag & Water was asked to perform an evaluation and provide recommendations to address the issue.
The evaluation followed the procedures described by Charles Burt in his 2004 report “Rapid Field Evaluation of Drip and Microspray Distribution Uniformity” and the Irrigation Training and Research Center, involving pressure measurements at key points in the field and flow rates emitted by a sample of emitters at specific locations. (Visit digitalcommons.calpoly.edu/bae_fac/71 for Burt’s full report.)
The evaluation data resulted in a DU of 0.77, which was low for the following reasons:
Low pressures
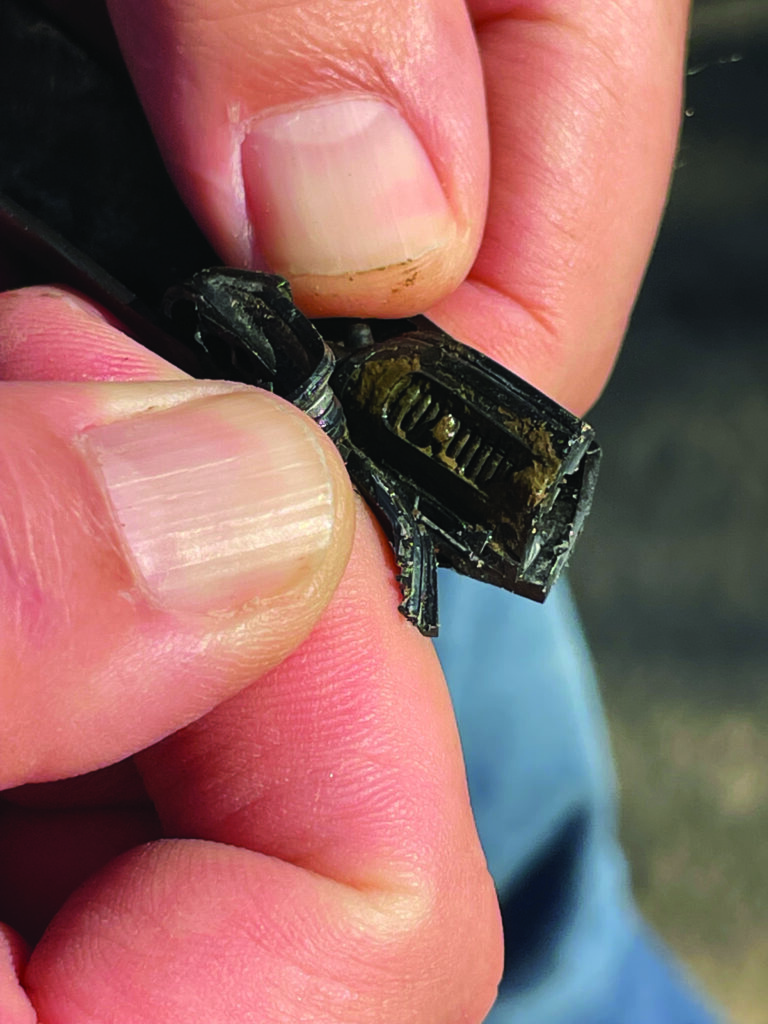
Emitter plugging
Comparing this drip system performance to other drip fields
Figure 1 (ITRC, 2019) highlights that this irrigation system is performing in the lowest third of the 700-plus evaluations over two decades of research. In other words, well over three quarters of the drip fields sampled by ITRC perform better.
Follow the money
Figure 2 illustrates the variability of irrigation and fertilizer applications across the case study field (DU = 0.77) using the UC Davis target annual input costs ($1,155 per acre).
The estimated $240,000 capital annual expense to irrigate and fertigate the 160 acres of case study almonds with a DU of 0.77 is distributed proportionally with the irrigation system uniformity. With a DU = 0.77, the driest acre will only receive about half of the dollars ($1,040) compared to the wettest acre ($1,960). While the average acre needs $1,500 to achieve the target, which is $1,155.
Can it get any better?
New dual-line drip systems with pressure-compensating emitters (12-plus emitters per tree) on flat ground can achieve a new system DU of 0.94 or better. Figure 3 illustrates expected variability for a system with a DU = 0.94.
Even with a DU of 0.94, which is near the top in terms of performance based on the ITRC results, there is still some variation in dollars applied throughout the field. From the acre with the highest expense ($1,327) to the acre with the lowest expense ($1,130) there is now only about a 15% variation. The best part is that we now only need to spend $1,229 on the average acre to achieve the target of $1,155.
The impact of DU on annual operating costs
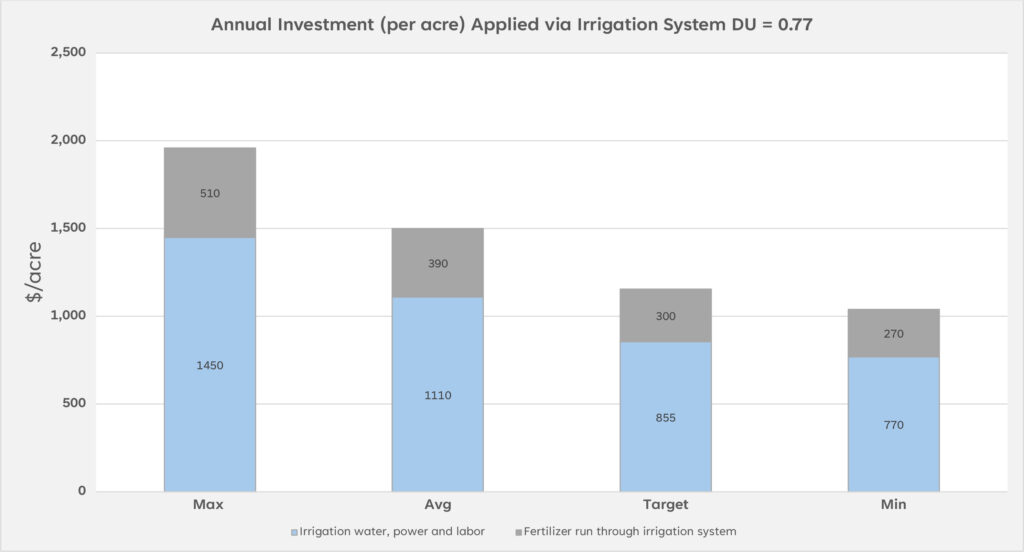

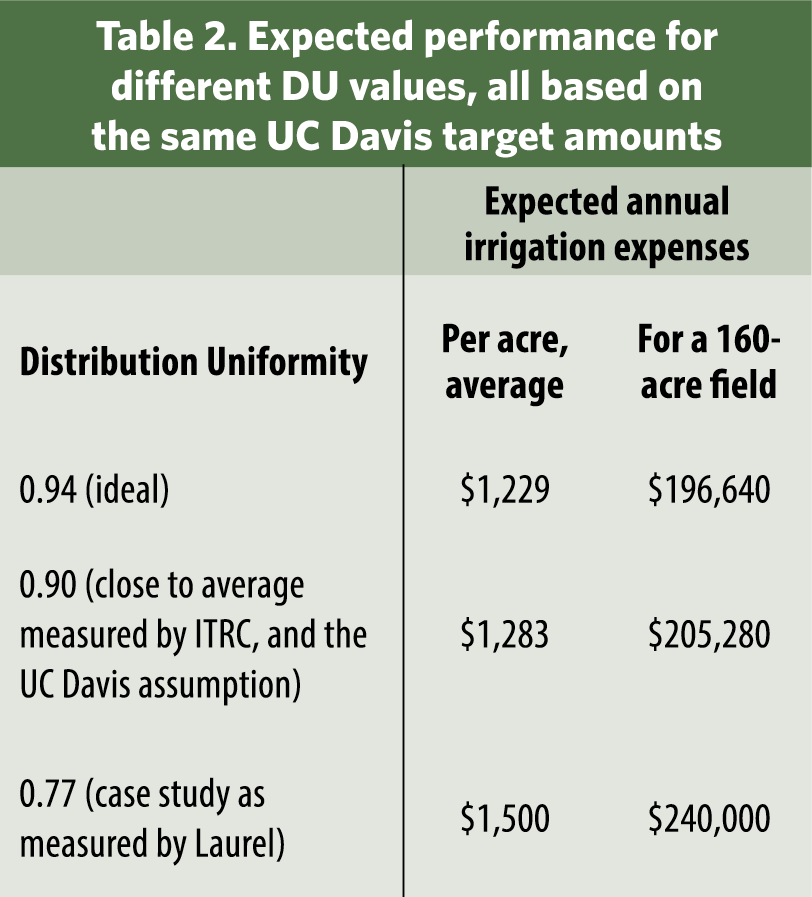 Table 2 compares a realistic range of expected capital costs for a realistic range of DU values.
As Table 2 shows, DU has a direct impact on the average per acre and total irrigation, fertigation, and labor expenses.
DU and beneficial water use
Some deep percolation beyond the target is expected to occur, regardless of the DU, when the majority (i.e., seven-eighths) of the field is fully irrigated for maximum yield.
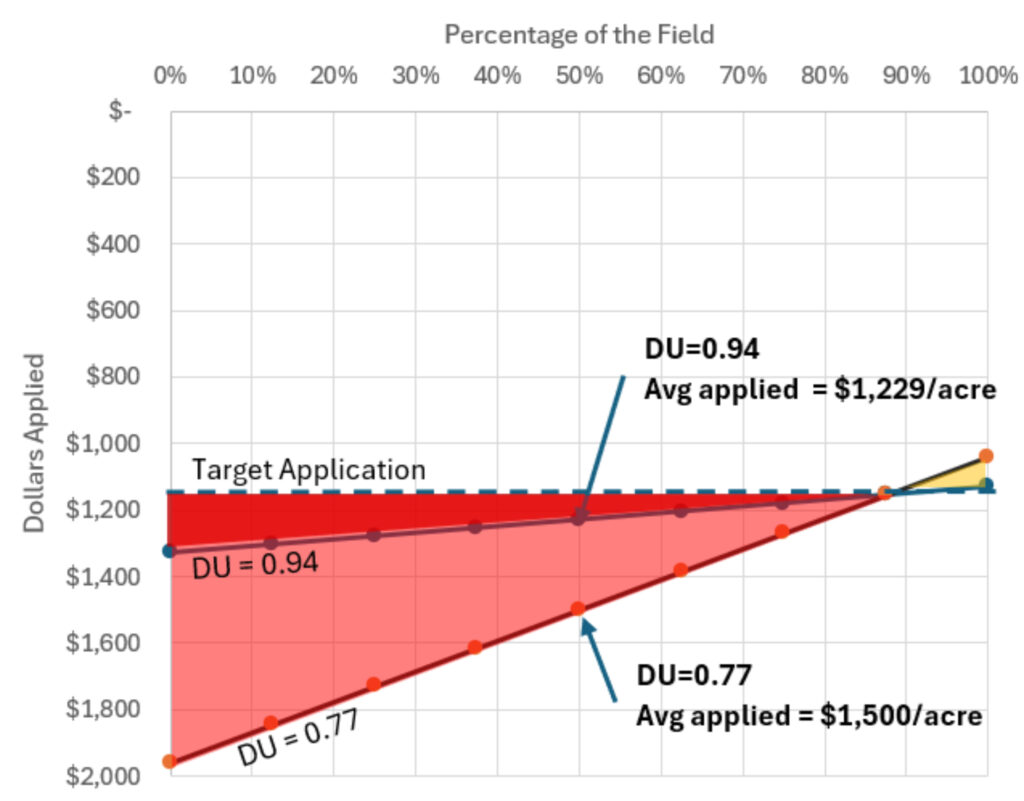
Figure 4 illustrates the expected differences in deep percolation between different DU values, for the same 160-acre almond orchard in dollar terms.
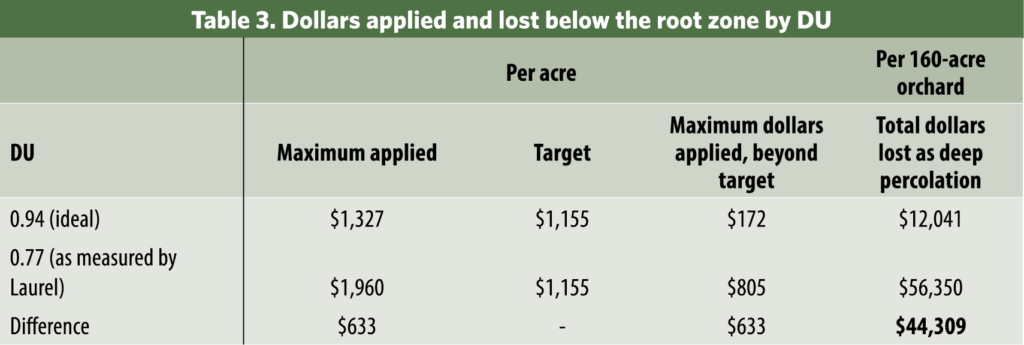 The area of each triangle, expressed in dollar terms, is compared in Table 3. This represents money spent yet lost below the root zone as deep percolation.
Assuming irrigators adjust applications to achieve uniform growth and include a leaching requirement in their target, growers with poor DU have greater input costs — and more of those costs are delivered below the root zone. All that money for no added benefit.
 On the other hand, if irrigators are not focused on the target depth and instead apply a given average depth each season regardless of the DU, they may not spend as much money on inputs. But yields will suffer, and money is still lost.
The importance of sound irrigation design, quality equipment, system maintenance and proper irrigation scheduling can have major impacts on a specialty crop grower’s financial success. By working with irrigation dealers that understand the impact of design and maintenance on DU, you will likely save money, water, fertilizer, power and labor.