Water sustains life. More than 70% of the global freshwater supply is used for our food production and, thus, water sustains life on our planet as we know it. Farmers play a critical role as stewards of this precious natural resource to produce the food we eat. Technologies like irrigation informatics play a helpful role in informing daily operational decisions of the grower.
Three core datasets have been transformative in creating irrigation informatics:
Due to this, the last five to 10 years have generated growth in what are termed agtech companies that have used this data and applied ambient computing, geospatial indexing and agronomic models to create field-bespoke irrigation informatics. Many agribusiness companies have incorporated these irrigation informatics into their own sensor and actuation platforms to deliver irrigation management services to the grower.
Demystifying this technology by highlighting its use through practical examples and reviewing its shortcomings will provide a simple path of adoption for growers who wish to improve their irrigation efficiency.
Demystifying this technology by highlighting its use through practical examples and reviewing its shortcomings will provide a simple path of adoption for growers who wish to improve their irrigation efficiency.
The economics of irrigation depends on the cost of pumping, volume and frequency of precipitation (offset), ratio of ground/surface water, and the type of irrigation system (furrow/flood, sprinkler, subsurface drip, etc.). Irrigation is never free anywhere in the world in that a) the efficacy of irrigation is the largest component in determining yield, and b) the human productivity involved in managing water is non-zero.
A typical, mature almond orchard in California’s Central Valley uses 4 acre-feet/acre ± 10% through its season. Given California’s temperate climate, almost 3.5 acre-feet/acre of that (>85%) is irrigated. Depending on whether it is a wet (surface water available in the snowpack) or dry year, the cost of water can range from $100 to $1,000/acre-foot (or more). Therefore, the total operating expense of irrigation water is between $350 and $3,500/acre.
Let’s assume it is an average of $2,000/acre (bundle fertigation, labor costs, etc.). Given the cost of production to be roughly $6,000/acre, irrigation is 30%-40% of the cash operating costs of running a mature orchard and its single largest cost. Even if there was a perfectly irrigated field (which is never the case), just navigating the +1% to 10% year-to-year changes in week-on-week water usage results in a greater than 10% opportunity of savings or > $200/acre.
The economic incentive for savings is clearly there provided the grower can realize these incentives at a reasonable cost. Irrigation informatics makes it easier and simpler for the grower to realize these economic benefits.
Irrigation informatics makes it easier and simpler for the grower to realize these economic benefits.
Irrigation science is constantly evolving. The Food and Agriculture Organization has published several methodologies over the years that aggregate research into a series of working papers. The following are two main steps considered to manage the optimal irrigation water usage in the agricultural field:
Step 1. Calculate the consumption – How much water “left” the irrigated area, which is a combination of several factors:
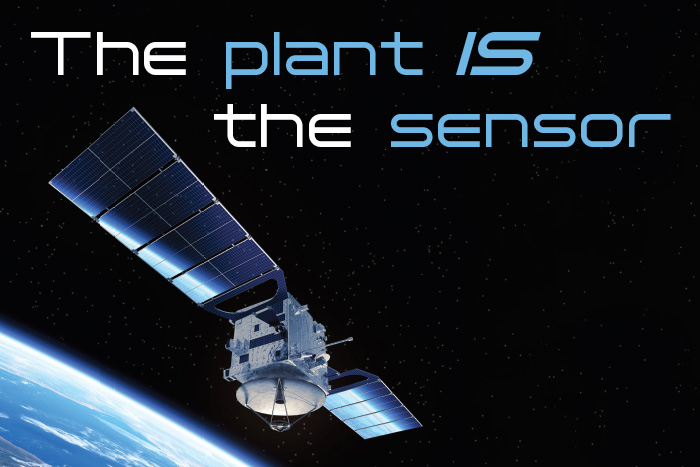
Using satellite, weather and soil information, growers have access to technology that provides these metrics on a weekly basis to make such a calculation possible. This type of technology provides actionable, field-specific insight on crop health, crop progression and crop water demand (evapotranspiration) anywhere on Earth.
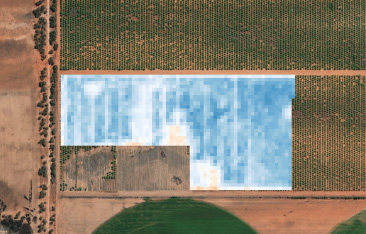
Common data include a field identifier, acreage, ETc (previous week), forecasted ETc (next week), field ETc uniformity (0-100) from the latest satellite date as shown in figure 1, year-to-date ETc for the current year, total year-to-date ETc for the previous year, and weekly average uniformity change as a percentage. With this dataset, growers have a complete picture of the field’s water consumption and can compare it to the prior year.
Benefits include quantified and directly observed growth metrics, accurate ETc (crop water demand) measures for irrigation management practices, crop health assessment via uniformity and uniformity change over time, and historical year-to-date ETc for current year and past year for contextual relevance.
What benefits can utilizing satellite data provide?
compliance — fact-based with data backup
productivity — better yield as irrigation/fertilization is optimized
cost savings — less waste on inputs
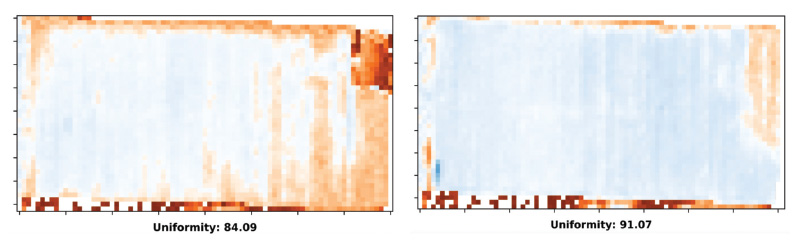
Here are some examples to illustrate these nuances. Figures 2 and 3 show how similar fields can have different uniformities. Figure 2 shows two fields operated by the same grower but with very different uniformities across the field. By getting timely information that is directly observed, the grower can address these nonuniformities early and prevent yield loss.
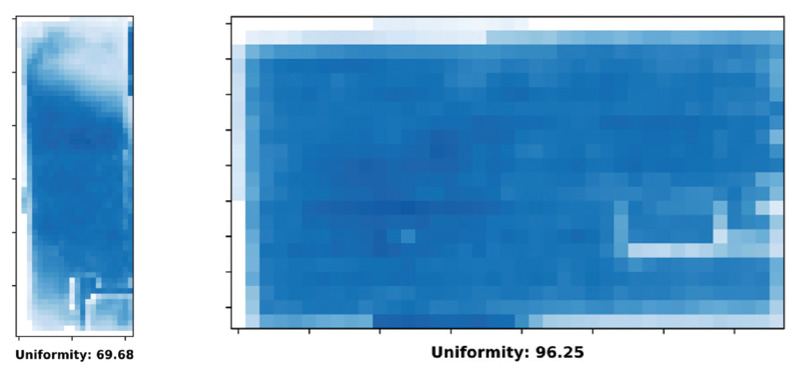
Similarly, the two fields shown in figure 3 were right next to each other and looked exactly the same to the trained human eye, but they have different nonuniformities in their ETc demand that can be seen spectrally by the satellites.
Step 2. Calculate the frequency and irrigation schedule – By using a first-order soil (field-specific) pedotransfer function (aka saturated hydraulic conductivity or Ksat), a grower can get their field’s infiltration rate that provides a spatial contour map of infiltration as shown in figure 4.
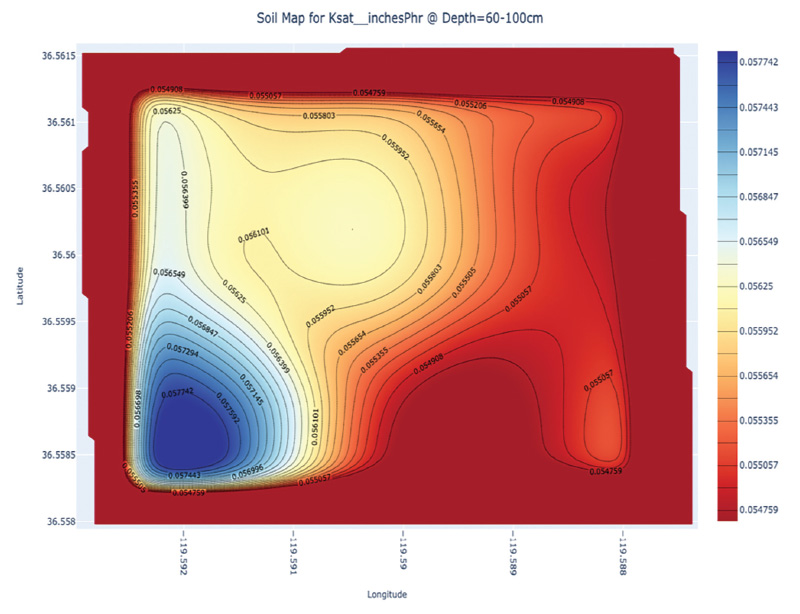
This map shows the southeast part of the field has a higher infiltration rate (0.054-0.057 inches/hour), which is a moderately high infiltration rate. This means that for a consumption of 2.1 inches for the previous week (or an average of 0.3 inches/day), it is advisable to calculate daily irrigation as follows:
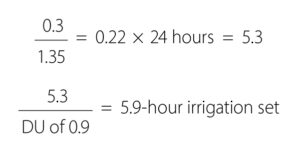
Perhaps the choice is made to “top-it-off” for a 6-hour set. Anything more than that, and the water would not be optimally used. Important note: This can be done intentionally to account for recharge or deficit irrigation, but in that case, it should be properly accounted for as such.
As the demand for food increases around the world, so, too, will the demand for increased water use. Satellite-based informatics and ag technology are rapidly advancing. Globally, growers play a pivotal role and by adopting these types of ag technology, we will be able to achieve an acceptable level of sustainability.