
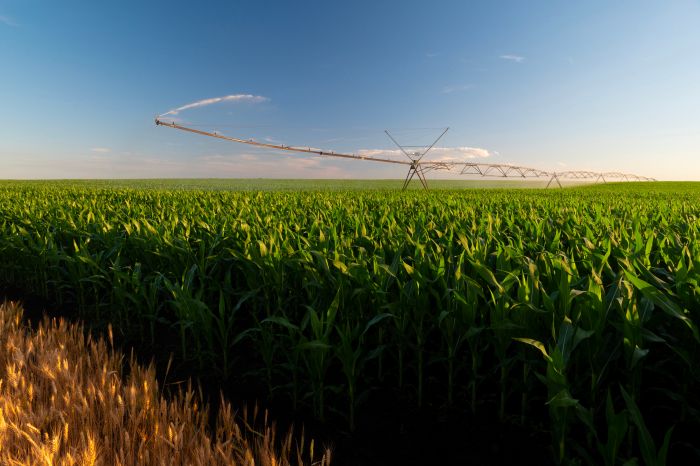
As drought, shifting rainfall patterns and tightening water supplies reshape U.S. agricultural water use, researchers, growers and policymakers need current, region-specific information to guide long-term decisions.
The Daugherty Water for Food Global Institute recently updated its Agricultural Water Use Trends in the U.S. infographic provides that perspective through the visual representation of 25 years of change in irrigated farmland, county by county, across the country.
The team’s previous version covered data from 1997 to 2017. The revised infographic extends that window through 2022, offering a longer and more current view of irrigation trends based on data from the USDA’s National Agricultural Statistics Service Census of Agriculture and its the 2023 Irrigation and Water Management Survey. The map also includes information from the 1998 Farm and Ranch Irrigation Survey.
“Once we updated the data in the map’s code we saw that there were significant enough changes to update the infographic to provide a clearer, more updated picture on agricultural water use today,” said Rebecca Carrillo, MES, ML, program coordinator at the Daugherty Water for Food Global Institute at the University of Nebraska.
The updated data shows that irrigated acreage increased by 3 million acres nationwide. Multiple factors contributed to the rise in irrigated farmland, and the data revealed that geographic location influenced whether irrigation increased or decreased in certain regions.
“Weather patterns, groundwater availability, regional policy changes and the changes farmers make, including the crops they grow all influence whether an area is experiencing an increase or a decrease in the irrigated farmland,” she said. “One factor I think that has remained the same or has become more prominent is precipitation variability.”
Water demand is increasing in areas where the rate of unpredictable precipitation patterns is rising. For example, in areas that have traditionally had access to abundant groundwater and reliable rainfall, irrigated cropland acreage is expanding to hedge against drought and an unpredictable climate. This includes areas such as Nebraska, the Midwest, the Eastern U.S. and the Mississippi River Valley.
“One factor that has remained the same or become more prominent is precipitation variability and water demand is increasing in areas that are experiencing unpredictable precipitation patterns,” Carrillo said. “Whether that’s drought or that it’s raining later in the year than usual, precipitation variability is affecting agricultural production and a lot of farmers are increasingly relying on irrigation.”
In regions where water supply is becoming more limited and there is increasing pressure on water resources, including California, Colorado’s Front Range, sections of the High Plains and Florida, the number of irrigated acres is declining.
New feature: County-level data
One new feature included in the infographic is its county-level data. In addition to a statewide and regional view, the map allows producers to see what’s happening in their immediate area and how that compares to neighboring counties.
“The map itself is divided by county,” said Carrillo. “Producers can compare by county and crops with their neighbors or farms the next county over.”
That level of detail can support irrigation planning decisions, such as whether to invest in new irrigation equipment or to rethink water management strategies. For growers and designers in particular, the long-term, county-level view is meant to ground on-the-ground decisions in solid historical context.
“For producers, it hopefully provides some insight into the future as well, so they have long-term context to make better-informed decisions on plans for purchasing irrigation equipment or vice versa if their region is decreasing in irrigated farmland,” she said.
The goal is not only to show where irrigation acreage changes, but also to deepen understanding of why those shifts are occurring.
“Our goal is to not only identify where irrigation was increasing or decreasing, but also to provide context on the local and regional factors that are driving the changes,” she said. “Hopefully it can help producers and anyone else who might be interested in this, like policymakers and other researchers, build off of the map that we’ve created.”
Share on social media:
3030 Clarendon Blvd. | Suite 300 | Arlington, VA 22201
Tel: 703.536.7080 | Fax: 703.536.7019
HOME | ABOUT US | ADVERTISE | SUBSCRIBE | CONTACT | PRIVACY POLICY | IA ANTITRUST STATEMENT