Understanding and dealing with water regulation is a continuing reality for growers, particularly in the western United States. Some growers, working with local districts, are trying to get ahead of reduced water allotments by getting a better irrigation data-driven understanding of how much water the crops are actually using by monitoring evapotranspiration.

It’s important for growers to understand their options when it comes to collecting data and connecting it to their own personal experience and observations, says Joel Kimmelshue, PhD, owner of LandIQ, Sacramento, California.
This type of data collection and analysis involves professionals with skillsets such as remote sensing analysts and geographic information tool analysts that complement each other in the field. Kimmelshue says incorporating two main technical disciplines, agricultural land-based science and spatial science, provides the best integrated approach to collecting data and connecting it on the grower’s level.
While companies like Kimmelshue’s often work with governmental and similar agencies, using data to understand water use practices is important for any grower. That’s especially true in places like California, where the Sustainable Groundwater Management Act requires that the California Department of Water Resources produce land use data. That’s applied as input data in their regulatory compliance modeling, which affects irrigation allotments.

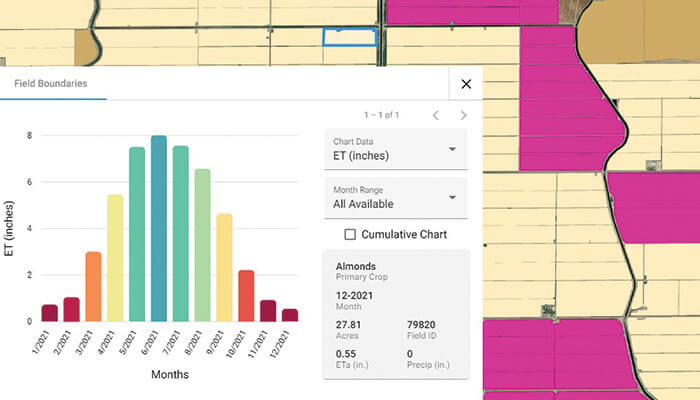
From Kimmelshue’s perspective, digital collection of evapotranspiration rates via satellite imagery is one step of the process. While those numbers are determined and then compared to high-resolution imagery, his crew also physically drives through much of the irrigated ag land in the state to create a digital footprint and do ground truthing to see how accurate the ET models are. That cross-referenced monitoring data helps determine how much water is actually evapotranspiring into the atmosphere as opposed to what’s going back into the ground. A groundwater sustainability agency will use those numbers in an allocation formula to find the right amount of water for the crop.
“Many of these GSAs have what they call a glide path,” says Kimmelshue. At first, the grower will be able to pump what was pumped in the previous year. Then, the next year will be an amount that’s a little bit reduced, with an end aim over a multiyear timeframe to reach a sustainable irrigation level. “You’ve got to figure out what you’re going to do over the next 20 years through project management actions to become sustainable. There’s some tough decisions that are going to have to be made. These guys are figuring out creative ways to survive as best they can. But at the same time, they need objective, scientific, factual data to make those decisions.”
These guys are figuring out creative ways to survive as best they can. But at the same time, they need objective, scientific, factual data to make those decisions.” – Joel Kimmelshue, LandIQ
It’s critical for growers to use data effectively in ag irrigation planning, almost treating it like having a running bank account with an allocation or deposit given at the beginning of the season. Using monthly reporting, growers can see how much they’ve debited that account. “Then they can track how they’re going through the summer irrigation season and make decisions about how they’re going to manage the water going forward,” Kimmelshue says. “On top of that, it’s a regulatory requirement for them to be compliant.”
Growers who are still beginning to understand the importance of collecting irrigation data should start with publicly available sources for reference ET crop coefficients and free guidelines for irrigation scheduling, he says. Then, track irrigation data over a number of months and get a feel for how well it matches visual observations of crop production.
“Really, the best observation of a grower’s field is the grower in the field seeing how well it’s doing,” he says. “They’ll have to tweak things based on that.”
Data collection and comparison is important for growers as irrigation regulations continue, says Aaron Fukuda, general manager of the Tulare Irrigation District, Tulare, California. As a conjunctive use irrigation district, it relies heavily on surface water not only for irrigation demand but groundwater recharge. The groundwater sustainability agency covers about 100,000 acres in total, with about 70,000 acres of irrigated agriculture.
“We’re currently seeing the impacts of the latest round of drought,” says Fukuda. “Our groundwater levels are actually at an all-time low now. Our boards were very nervous about what was going to happen this year.”
Instead of trying to put off dealing with inevitable irrigation restrictions, the group began implementing water use reduction ahead of schedule to help manage the transition, he says. “In order to do that, we needed a metric to measure how much groundwater we were using.”
Collecting evapotranspiration data provided a baseline for understanding the amount of water actually being used, including how much was being released to the atmosphere compared to how much was being returned to the water table. The most important part was comparing that data against ground truthing methods to calibrate the satellite imagery.
“It’s illuminated growers’ understanding of how much water they were using,” Fukuda says.
Tracking that data over time in a dashboard provides opportunities to see how different irrigation practices and weather events impact the overall water usage. That gives growers the ability to use those models to modify irrigation behaviors to maintain yield within limits and make better decisions to protect profits.